
| 일 | 월 | 화 | 수 | 목 | 금 | 토 |
|---|---|---|---|---|---|---|
| 1 | 2 | 3 | 4 | 5 | 6 | 7 |
| 8 | 9 | 10 | 11 | 12 | 13 | 14 |
| 15 | 16 | 17 | 18 | 19 | 20 | 21 |
| 22 | 23 | 24 | 25 | 26 | 27 | 28 |
| 29 | 30 |
- 업비트 차트
- 나만의 사이트모음집
- 업비트
- 즐겨찾기
- Prism
- c# 업비트 api키 목록
- c# 업비트
- 라이브 차트
- c# api호출
- 북마크
- c# 차트
- c# restapi 호출
- Upbit API
- XAML
- 업비트 c#
- c# websocket
- c# 라이브 차트
- upbit
- 차트
- Chart
- c# maui
- WPF
- C#
- 업비트 API
- c# restapi
- maui
- Today
- Total
하아찡
[C#/WPF] Upbit 프로젝트 Chart - 3(그리드 라인) 본문
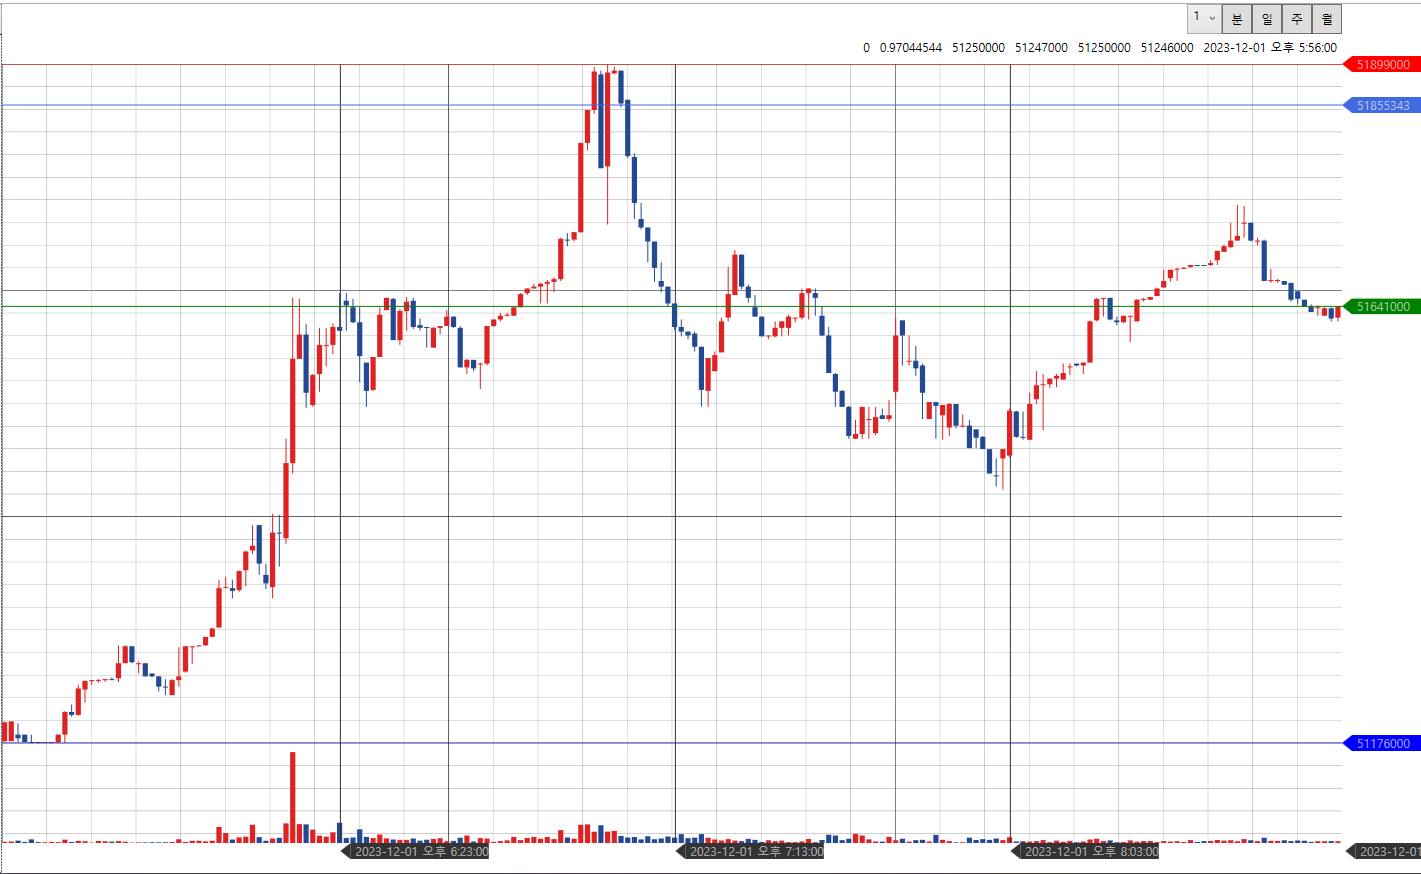
이렇게 생긴건데 현재는 DrawLine함수에서 선 색상을 변경시켜서 보이지 않게 해놨음.
Canvas에서 라인을 그려주는 이벤트
/// <summary>
/// 캔버스에 그리드를 그리는 이벤트 Load때와 SizeChange때 발생함.
/// 추후 시간에 따른 라인으로 변경할예정
/// 23.11.11
/// </summary>
private DelegateCommand<object> commandgridlines;
public DelegateCommand<object> CommandGridLines =>
    commandgridlines ?? (commandgridlines = new DelegateCommand<object>(ExecuteCommandGridLines));

void ExecuteCommandGridLines(object sender)
{
    if (sender is not Grid)
        return;

    Grid grid = (Grid)sender;
    MyGrid = (Grid)sender;
    GridHeight = grid.ActualHeight;
    TickWidth = Math.Max(grid.ActualWidth / PrintCandle, 1.6) - CandleMargin;
    ChartTickHeight = GridHeight / (MaxPrice - MinPrice);
    VolumeTickHeight = GridVolumeHeight / MaxVolume;

    double height = (grid.ActualHeight / lines);
    double width = (grid.ActualWidth / lines);
    HorLine = DrawLine(height, true);
    VerLine = DrawLine(width, false);

    if (PrintChartYAxis is not null)
    {
        PrintChartYAxis[1].Y = GridHeight + GapYAxis;
    }

    GetCandleTime();
    GetCoinPrice();
}
해당 이벤트는 사이즈가 변경될때마다 작동하여 캔들 넓이와 높이값들을 전부다 여기서 구해서 처리함.
PrintChartY[1]은 해당 차트 최소값위치를 표시하기위해 항상 고정값으로 넣어줌.
DrawLine
/// <summary>
/// 캔버스에 라인을 그려줌.
/// 23.11.11
/// </summary>
/// <param name="gap">줄 간격</param>
/// <param name="type">가로 / 세로</param>
/// <returns></returns>
private List<line> DrawLine(double gap, bool type)
{
    List<line> lines = new List<line>();

    for (int i = 0; i < this.lines; i++)
    {
        line add = new line();
        if (type)
        {
            //가로
            add.FromX = 0;
            add.FromY = i * gap;
            add.ToY = i * gap;
        }
        else
        {
            //세로
            add.FromX = i * gap;
            add.ToX = i * gap;
            add.FromY = 0;
        }
        if (i % 10 == 0)
        {
            add.LineThickness = 0.6;
            add.LineColor = Brushes.Transparent;//Brushes.Black;
        }
        else
        {
            add.LineThickness = 0.3;
            add.LineColor = Brushes.Transparent;//Brushes.Gray;
        }
        lines.Add(add);
    }

    return lines;
}
GetCandleTime
private void GetCandleTime()
{
    if (PrintTick is null && Market == "")
        return;
    PrintChartXAxis = new ObservableCollection<ChartSideCursor>();
    double TickWidth = (this.TickWidth + CandleMargin);
    for (int i = PrintCursor + (PrintTick.Count - 1), j = PrintCandle + 1; i >= PrintCursor; i -= 50, j -= 50)
    {
        ChartSideCursor chart = new ChartSideCursor();
        chart.X = (j - (PrintCandle - PrintTick.Count)) * TickWidth - (TickWidth / 2);
        chart.Y = 0;
        chart.Type = "Time";
        chart.CursorValue = TickData[i].kst;
        chart.BackColor = MyColors.ColorDefault;
        chart.Color = MyColors.ColorDefaultBack;

        PrintChartXAxis.Add(chart);
    }

}
차트 해당 캔들 위치 시간별로 출력 현재는 50개 기준으로 출력으로 해놨음.
GetCoinPirce
/// <summary>
/// 해당 코인이 보유중일경우 차트에 출력.
/// </summary>
private void GetCoinPrice()
{
    if (Market == "")
        return;

    if (PrintChartYAxis[4].Y <= 0)
    {
        UpbitFunctions.Accounts FAccount = new UpbitFunctions.Accounts();
        double price = FAccount.GetAccountCoinPrice(Market);
        PrintChartYAxis[4].CursorValue = price.ToString();
    }
    double value = Convert.ToDouble(PrintChartYAxis[4].CursorValue);
    if (value >= 0)
    {
        double yvalue = (GridHeight * ((MaxPrice - value) / (MaxPrice - MinPrice))) + GapYAxis;

        //차트 범위 초과했을경우 안보이게 수정
        if (GridHeight <= yvalue || 0 >= yvalue)
            yvalue = -100;

        PrintChartYAxis[4].Y = yvalue;
    }
    else
    {
        PrintChartYAxis[4].Y = -100;
    }
}
현재 보는 차트가 내가 보유중인 코인일경우 내 평단가를 차트에 표시함.
단, 보이는 범위안에 없을경우 Y값을 -100으로 설정해서 보이지않게함.
PrintChartYAxis[4]은 내 평단가를 띄워주기위해 존재
SetCtor
private void SetCtor()
{
    PrintChartYAxis = new ObservableCollection<ChartSideCursor>();
    ChartSideCursor max = new ChartSideCursor();
    max.X = 0;
    max.Y = GapYAxis;
    max.Type = "MaxPrice";
    max.CursorValue = "";
    max.BackColor = Brushes.Red;
    max.Color = MyColors.ColorDefaultBack;

    ChartSideCursor min = new ChartSideCursor();
    min.X = 0;
    min.Y = MyGrid.ActualHeight + GapYAxis;
    min.Type = "MinPrice";
    min.CursorValue = "";
    min.BackColor = Brushes.Blue;
    min.Color = MyColors.ColorDefaultBack;

    ChartSideCursor cursor = new ChartSideCursor();
    cursor.X = 0;
    cursor.Y = -100;
    cursor.Type = "Cursor";
    cursor.CursorValue = "";
    cursor.BackColor = Brushes.RoyalBlue;
    cursor.Color = MyColors.ColorDefaultBack;

    ChartSideCursor nowprice = new ChartSideCursor();
    nowprice.X = 0;
    nowprice.Y = -100;
    nowprice.Type = "NowPrice";
    nowprice.CursorValue = "";
    nowprice.BackColor = Brushes.Green;
    nowprice.Color = MyColors.ColorDefaultBack;

    ChartSideCursor avgprice = new ChartSideCursor();
    avgprice.X = 0;
    avgprice.Y = -100;
    avgprice.Type = "AvgPrice";
    avgprice.CursorValue = "-100";
    avgprice.BackColor = Brushes.Gold;
    avgprice.Color = MyColors.ColorDefaultBack;

    PrintChartYAxis.Add(max);
    PrintChartYAxis.Add(min);
    PrintChartYAxis.Add(cursor);
    PrintChartYAxis.Add(nowprice);
    PrintChartYAxis.Add(avgprice);

    MaxVolume = 0;
    KeepPrintCursor = 0;
    PrintCandle = PrintDefaultCandle;
    TickWidth = Math.Max(MyGrid.ActualWidth / PrintCandle, 1.6) - CandleMargin;
    PrintCursor = 0;
    MaxPrice = 0;
    MinPrice = 9999999999;
}
코인을 새롭게 불러올때마다 기본적인 변수값 셋팅을 다시해줌.
PrintChartYAxis고유로 지정해둔 번호는 0~4번
0번은 차트 Max값을 표시
1번은 차트 Min값을 표시
2번은 마우스 커서 현재값을 표시
3번은 현재 차트 최근값을 표시
4번은 내가 코인을 보유중일경우 평단가를 표시
캔버스 MouseMove이벤트
/// <summary>
/// 그리드에서  마우스가 움직였을때 차트를 갱신시켜주기위한 이벤트
/// 23.11.14
/// </summary>
private DelegateCommand<MouseEventArgs> commandmousemove;
public DelegateCommand<MouseEventArgs> CommandMouseMove =>
    commandmousemove ?? (commandmousemove = new DelegateCommand<MouseEventArgs>(ExecuteCommandMouseMove));

double move;
void ExecuteCommandMouseMove(MouseEventArgs e)
{
    if (MyGrid != null)
    {
        move = e.GetPosition(MyGrid).X;
        if (Market != "")
        {
            GetCandleInfo(move);
            double price = MaxPrice - ((MaxPrice - MinPrice) * (e.GetPosition(MyGrid).Y / MyGrid.ActualHeight));
            PrintChartYAxis[2].CursorValue = price.ToString(FLen);
            PrintChartYAxis[2].Y = e.GetPosition(MyGrid).Y + GapYAxis;
            if (CandleMouseState)
            {
                if (PrintTick.Count <= 0)
                    return;
                ShowChart();
            }

        }

    }

}
현재 마우스 포커스에서 포커스위치 값을 코인 금액으로 변환하기위해
MaxPrice - ((MaxPrice - MinPrice) * 현재 마우스Y값 / 현재 캔버스 높이값)
식을 작성해서 현재 포커스값을 금액으로 변환하였음.
나머지는 MouseDown/Up Event를 사용해서 눌린상태일때 움직일경우 차트를 움직이게 할 수 있게함.
GetCandleInfo
private void GetCandleInfo(double X)
{
    double value = (MyGrid.ActualWidth - Math.Max((MyGrid.ActualWidth - X), 0.1)) / (TickWidth + CandleMargin);
    int index = PrintCursor + Convert.ToInt32(Math.Floor(value));
    Structs.Tick tick = GetTick(index);
    if (tick is not null)
    {
        string len = tick.OP.ToString().Split(".")[0];
        FLen = len.Length > 1 ? (len.Length > 2 ? "F0" : "F4") : "F8";
        PrintOp = tick.OP.ToString(FLen);
        PrintHp = tick.HP.ToString(FLen);
        PrintLp = tick.LP.ToString(FLen);
        PrintTp = tick.TP.ToString(FLen);
        PrintTime = tick.KST;
        TestNum = tick.Volume;
    }

}
MouseMove Event에서 작동하는 함수인데 해당 포커스 위치에 캔들이 있을경우 캔들 정보를 띄워줌.
현재는 테스용으로 디자인이 매우 나쁜상태.
'C# > 코인프로그램 - 코드' 카테고리의 다른 글
| [C#/WPF] Upbit프로젝트 PublicFunctions(Upbit관련함수) (2) | 2023.12.02 |
|---|---|
| [C#/WPF] Upbit 프로젝트 Chart - 4(캔들) (2) | 2023.12.02 |
| [C#/WPF] Upbit 프로젝트 Chart - 2(전체코드) (0) | 2023.12.01 |
| [C#/WPF] Upbit 프로젝트 Chart - 1 (0) | 2023.11.30 |
| [C#/WPF] Upbit프로젝트 Order (0) | 2023.11.30 |
